Case Study 1: Creating a S2P Connection Server
Learn how to use the different handling mechanisms implemented as well as obtaining data from a server.
Objectives
- Creating a server instance with the HydroRTC library
- Access data from a server and use it in a web application.
- Access the different mechanisms for handling events and data.
Architecture
The connection between a peer and a server is established through the use of the client object. After the library has been loaded into the server, and the HTML file accessed, the server is given through the development of the communication channels.
let client = new HydroRTCClient('user-name')
//Once the client is connected to the server:
client.on('connect', (data) => {
    //Option to feed the web application
})
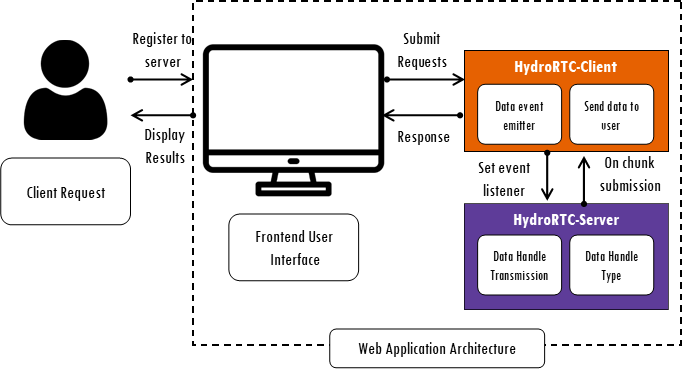
User Interface
A sample user inteface has been given in the example, to create the connection with the server, which then allows the user to retrieve different types of data available as a list of buttons that have a specificed path accesing the server. For each datatype, we assume the developer is giving direct access to the user of a specified directory file:
  <div class="button-row">
      <!-- Buttons for collaborative data exchange usecase-->
      <button id="netcdf-data">Request netCDF Data</button>
      <br><br>
      <button id="hdf5-data">Request HDF5 Data</button>
      <br><br>
      <button id="tiff-data">Request TIFF Data</button>
      <br><br>
  </div>
An overlay (hidden window) is applied over the request to showcase the different datatypes once they have arrived to the user.
Mechanisms
There are two mechanisms that are shown in the example to highlight the use of the S2P connection. Specifically, we have the stream data and smart data transmission.
Stream Data
The stream data is a simple connection given to the user to grab data and visualize it in screen. For this, we are using a simple JSON viewer that allows a sample overlook of the data. An example data request is done using the following code:
document.getElementById('tiff-data').onclick = function () {
  //Shows the time it took for data to arrive from server to peer.
    let start = performance.now();
    let end = 0;

    let dataStream = hydroRtcClient.getTIFF({ dataPath: './data/tiff/' })

    // Remove all previous 'data' event listeners
    dataStream.removeAllListeners('data');

    if (dataStream != null) {
        dataStream.on('data', (data) => {
            console.log(data)
            end = performance.now();
            console.log(`Total time: ${(end - start) / 1000} s.`);
        })
    }
    dataStream = null
}
Smart Data Transmission
Similarly, the smart data transmission allows for data to come at a specified rate from the server to the user and show on screen on an overlay display, with data being a sample of different timeshots. The data request handler looks like follows:
document.getElementById('start-smart-data').onclick = function () {
    // Get delivery priorities values
    let resolution = document.getElementById('resolution').value
    let frequency = document.getElementById('frequency').value

    // Requesting for smart data by specifiying data location
    smartDataHandler = hydroRtcClient.receiveSmartData('./data/jpeg/', frequency, resolution)
    //Rest of the code
This represents a nice way to do timelaps using just a server listener that sends data back to the user. Think on streamflow data, static map generation, etc.
Receiving Data
The results can be found as buffers within the availableResults object. To view them as arrays, you can call the following method:
Interfacing and Downloading Data
We have included a HydroLang instance to visualize data using the JSON reader implemented. We are working towards creating visualizing options as well for formats like TIFF,GeoTIFF and others.